
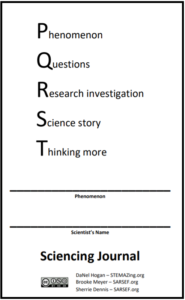
PQRST Sciencing Journal V4 (recently UPDATED)
The PQRST Sciencing Journal is the A-Z (or at least P-T) template for helping your students process a phenomenon, play to learn, identify variables, design an experiment, conduct experiment to collect data, make a claim supported by evidence with scientific reasoning to explain it, and then keep thinking in questions.
There are three versions of the notebooks.
-
The PQRST Basic Sciencing Journal is for experiments with two independent variable settings or options young scientists are testing – this versus that, a generic toy car versus a brand name toy car, one brand of plastic jumping frog vs. another, one type of food vs. another for composting earthworms. (NOTE: We encourage young scientists to resist the urge to average their data and graph only the averages. Instead, there are two choices for the PQRST Basic Sciencing Journal. Either have students graph their data on a Line/Dot Plot, best for students up through 5th grade, or use a graph with Average Bars with Data Points, best for students in 6th grade and up. You can see examples of both below.)
-
The PQRST Sciencing Journal is for experiments with numerous settings for the independent variable – testing different heights, angles, sizes, anything with more than two settings for the independent variable. (NOTE: We encourage young scientists to resist the urge to average their data. Instead, it is better to leave each trial data points to enable richer data talks and analysis. The average point can be included with the range of data points.)
-
The PQRST Sciencing: Beyond Average Journal is for experiments with numerous settings for the independent variable and goes further in asking young scientists to average the test data and find or calculate the standard error for a more complete data analysis. This can be done on their own or using a ready made spreadsheet or creating their own spreadsheet depending on your learning objectives.
If you want young scientists to focus on data analysis, you can use this Google Sheets file, which will automatically graph the data and calculate the standard deviation and standard error. It also provides instructions on how to correctly fit the error bars in the data to match the standard error calculated from the data. It allows for both simple analysis and more in-depth analysis looking at standard deviation and standard error. Find file here and make a copy of it for your use and use with students: PQRST Data and Graph Google Sheets file HERE.
Click HERE for example of PQRST Data and Graph file with real data from Hot Wheels car rolling down a ramp and onto carpet
NOTE FOR ALL JOURNALS: When printing the journals as books, print the document DOUBLE-sided and flipped on the SHORT edge. Then fold it in half like a taco (instead of a burrito) and staple it along the fold. If you prefer to print the journals piece-by-piece, one page at a time, you can find the journals split into pieces by scrolling down further past the complete journals below.
PQRST Basic Sciencing Journal V4 – Line/Dot Plot
 Loading...
Want to edit this journal yourself? Find the Word version of PQRST Basic Sciencing Journal 4 – Line/Dot Plot HERE.
Sample PQRST Basic Science Journal V4 – Line/Dot Plot from Raising Raisins phenomenon (putting raisins in clear soda like 7-Up or Sprite) and observing what happens)
Loading...
PQRST Basic Sciencing Journal V4 – Average Bars with Data Points
Loading...
Want to edit this journal yourself? Find the Word version of PQRST Basic Sciencing Journal 4 – Average Bar with Data Points HERE.
Sample PQRST Basic Science Journal V4 – Average Bar with Data Points from Raising Raisins phenomenon (putting raisins in clear soda like 7-Up or Sprite) and observing what happens)
Loading...
PQRST Sciencing Journal
Loading...
PQRST Sciencing Journal: Beyond Average
Loading...
PQRST Sciencing Journal Pieces – One Page At A Time
The Sciencing Journals have many of the same pieces. In the case the pieces are unique to the journal, the name of the piece will include either Basic, Sciencing, or Beyond. Otherwise, the piece is the same for all the journals.
-
PQRST Basic Piece 1 Front Cover and Thinking More
-
PQRST Sciencing Piece 1 Front Cover and Thinking More
-
PQRST Beyond Piece 1 Front Cover and Thinking More
-
PQRST Piece 2 PQ Notice and Wonder
-
PQRST Piece 3 Play to Learn Notice and Wonder
-
PQRST Piece 4 Basic Testable Question Multiple Hypotheses and Data Predictions
-
PQRST Piece 4 Sciencing and Beyond Testable Question Multiple Hypotheses and Data Predictions
-
PQRST Piece 5 Research Investigation
-
PQRST Basic and Sciencing Piece 6 Data Table and Graph
-
PQRST Beyond Piece 6 Data Table and Graph
-
PQRST Piece 7 Data Observation and Talk
-
PQRST Basic Piece 8 Science Story CER
-
PQRST Sciencing and Beyond Piece 8 Science Story CER