STEMAZing Slow Reveal Graphs
Slow Reveal Graphs designed by STEMAZing Teacher Leaders. #SlowRevealGraph is an instructional routine adaptable for all ages which promotes sensemaking about data.
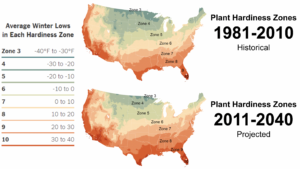
Slow Reveal Graph – Growing Zones in the United States
This slow reveal graph has been designed specifically to start to address the 4th grade 4.E1U1.8 Arizona Science Standard. Special thanks to STEMAZing Teacher Leader Mabel Rivera who co-designed this slow reveal graph. Google Slide ...
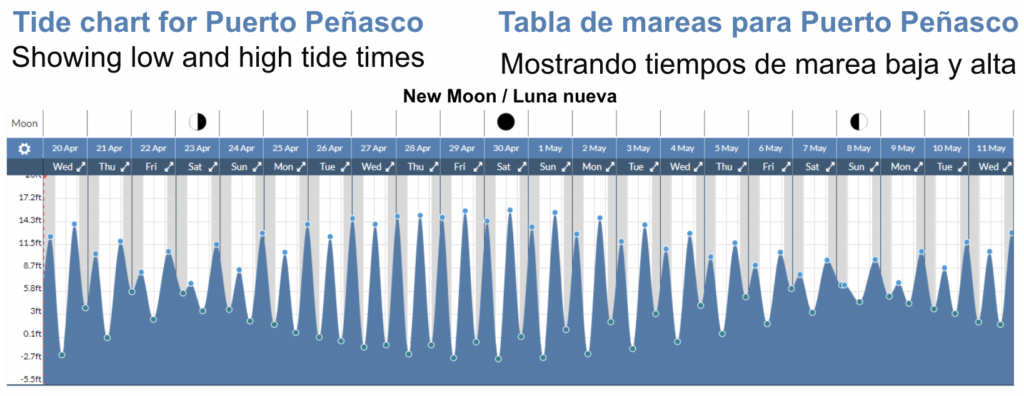
Slow Reveal Graph: How do the phases of the moon impact tides?
This slow reveal graph has been designed specifically to start to address the 6th grade 6.E2U1.9 Arizona Science Standard. Google Slide Deck for Teachers (without question prompts on slides, includes teacher notes) Google Slide Deck ...
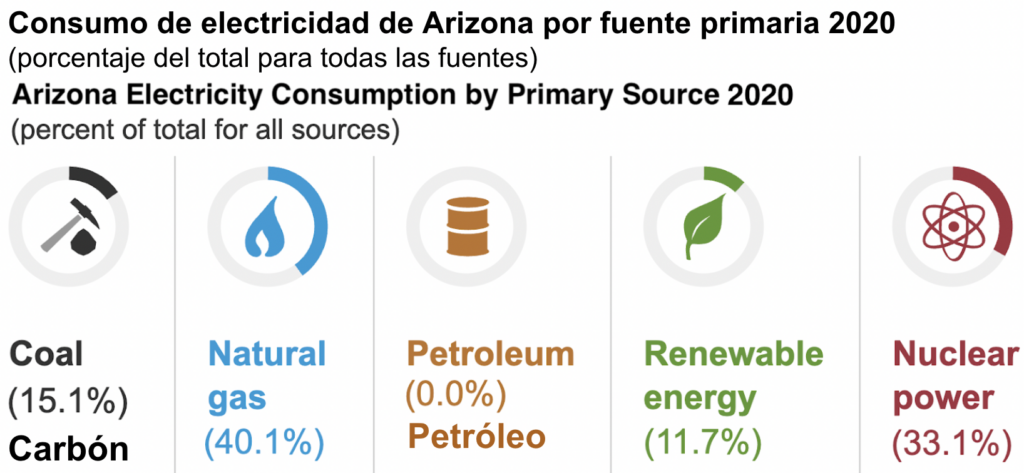
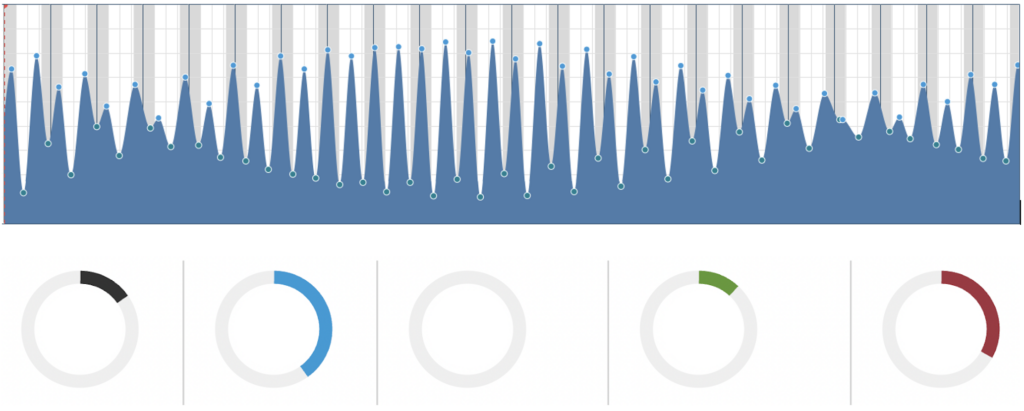
Slow Reveal Graph: Where does Arizona’s electricity come from?
This slow reveal graph has been designed specifically to start to address the 4th grade 4.P4U3.4 Arizona Science Standard. Special thanks to STEMAZing Teacher Leader Kathy Hartley who co-designed the student worksheets for this slow ...
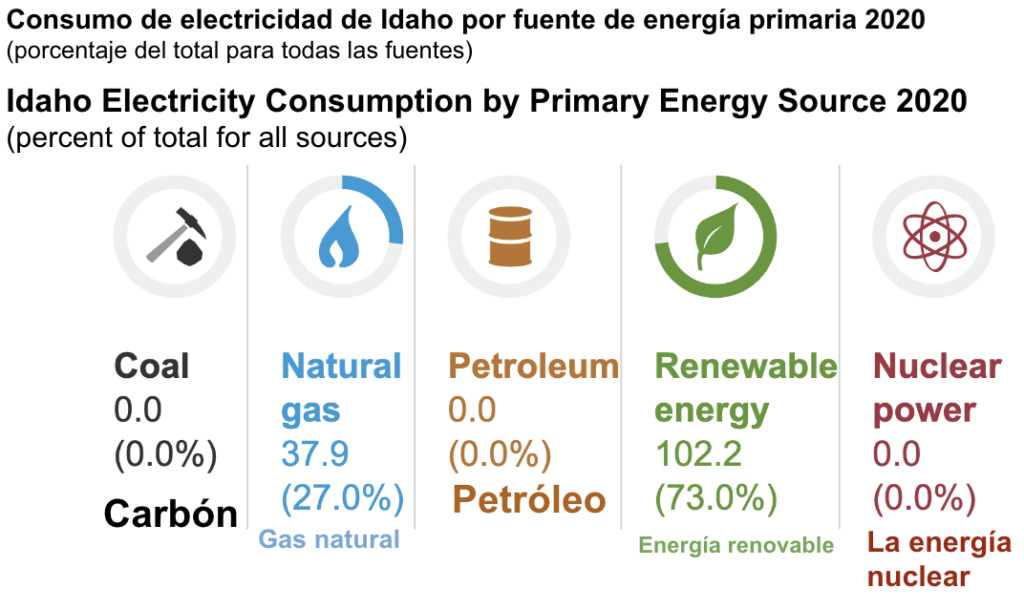
Slow Reveal Graph: Where does Idaho’s electricity come from?
This slow reveal graph has been designed specifically to start to address the 4th grade 4-ESS-3.1 Idaho Science Standard. Special thanks to STEMAZing Teacher Leader Kathy Hartley who co-designed the student worksheets for this slow ...
Slow Reveal Graphs – Official Website
Slow Reveal Graph (#SlowRevealGraph) is an instructional routine that promotes sensemaking about data. This highly engaging routine uses scaffolded visuals and discourse to help students (in K-12 and beyond) make sense of data ...