Skip to content
Menu
Home
Register
#STEMontheCheap
Resources
Hire Us
About
Privacy Policy
Facebook
Linkedin
Youtube
Email
Menu
Home
Register
#STEMontheCheap
Resources
Hire Us
About
Privacy Policy
Lawrence Livermore Energy Flow Graphic
How to read a LLNL Flow Chart (Sankey diagram) video
Read More
Change Over Time Lesson for U.S. Primary Energy Consumption
Read More
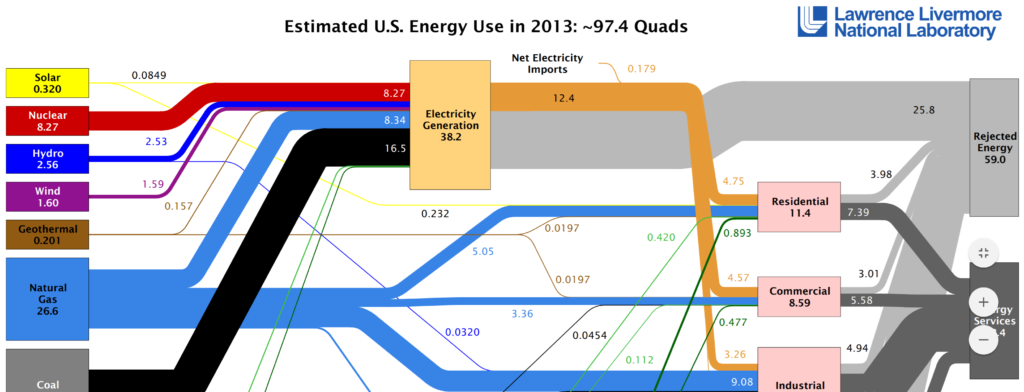
2013 LLNL Energy Flow Chart
Read More
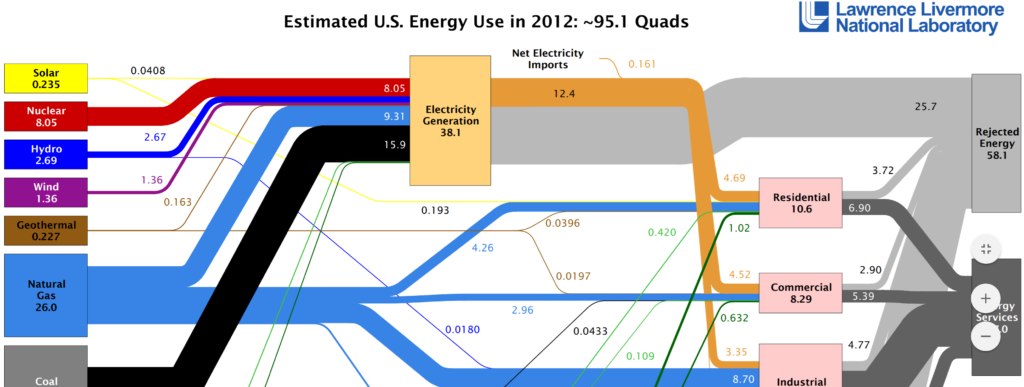
2012 LLNL Energy Flow Chart
Read More
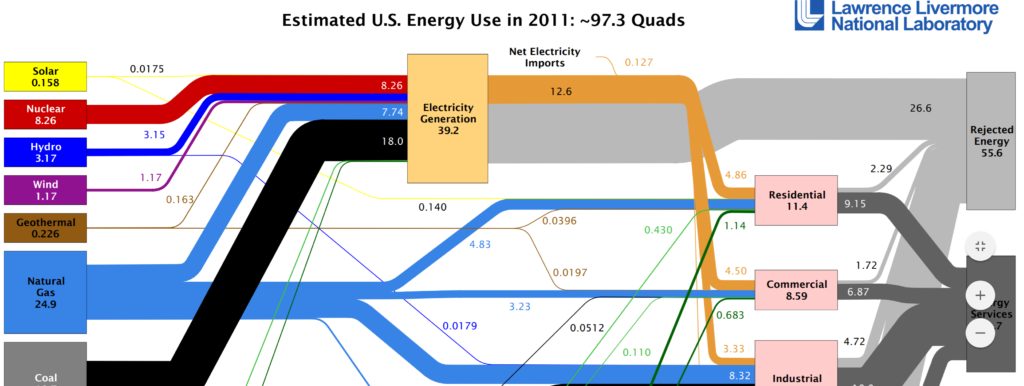
2011 Estimated U.S. Energy Use
Read More
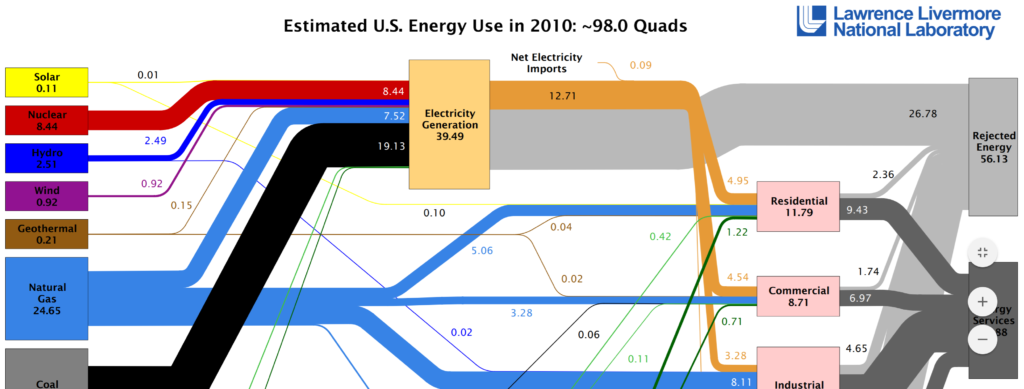
2010 Estimated U.S. Energy Use
Read More
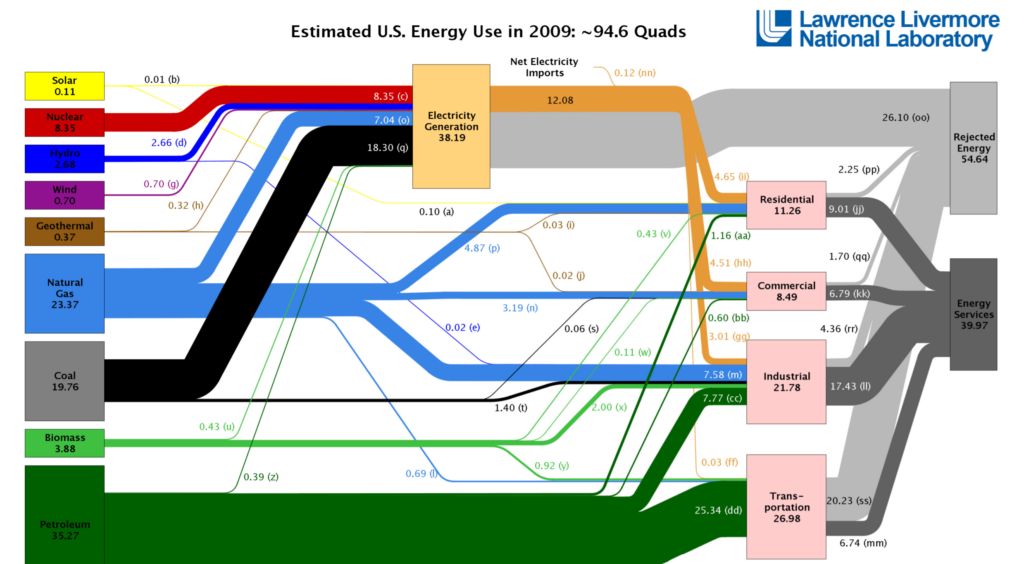
2009 Estimated U.S. Energy Use
Read More
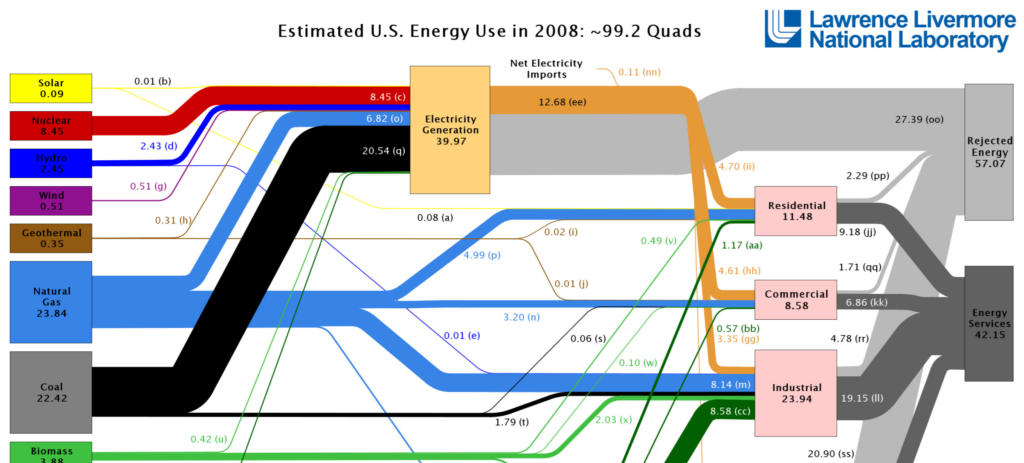
2008 Estimated U.S. Energy Use
Read More
Scroll To Top