Resources
Photosynthetic Floatation – Science Snack from the Exploratorium
Photosynthetic organisms capture energy from the sun and matter from the air to make the food we eat, while also producing the oxygen we breathe. In this Snack, oxygen produced during photosynthesis makes leaf bits float like bubbles in water. Learn more about this Science Snack from the Exploratorium including Video Demonstration of what to…
Read MoreWe are connected – Dr. Jessica Dunkley
https://youtu.be/epqc7RD19-c Dr. Jessica Dunkley advocates for more diversity in medical professions to eliminate discrimination in her field. As part of the Ready2Listen campaign, we invited participants to tell us what drives them, what makes them proud and what advice they would offer to youth today. The campaign empowers Indigenous people across Turtle Island and counters…
Read MoreNunaniuryuraqama: Maintaining Self Through Environmental Energy
Nunaniuryuraqama: Maintaining Self Through Environmental Energy is presented by Alaska Housing Finance Corporation and AK EnergySmart. Mayaq Irussaar Qip’arluk Kagganaq Maangyaar (Valerie Tony) is the latest representation of her Yup’ik and Sup’ik ancestry of the Kuigpak Tradition, geographically the Lower Yukon Delta. She is an interpreter of the Kuigpak oral history and strives to help…
Read MoreKids Against Climate Change
All around the world, kids are learning about climate change. Why should we care? Duh – it’s our future! And we want our voices heard!!! This is a site created by kids (and a teacher) for kids (and teachers). Take a look at what other kids have shared. Then share an idea of your own.…
Read MoreSlow Reveal Graph – Growing Zones in the United States
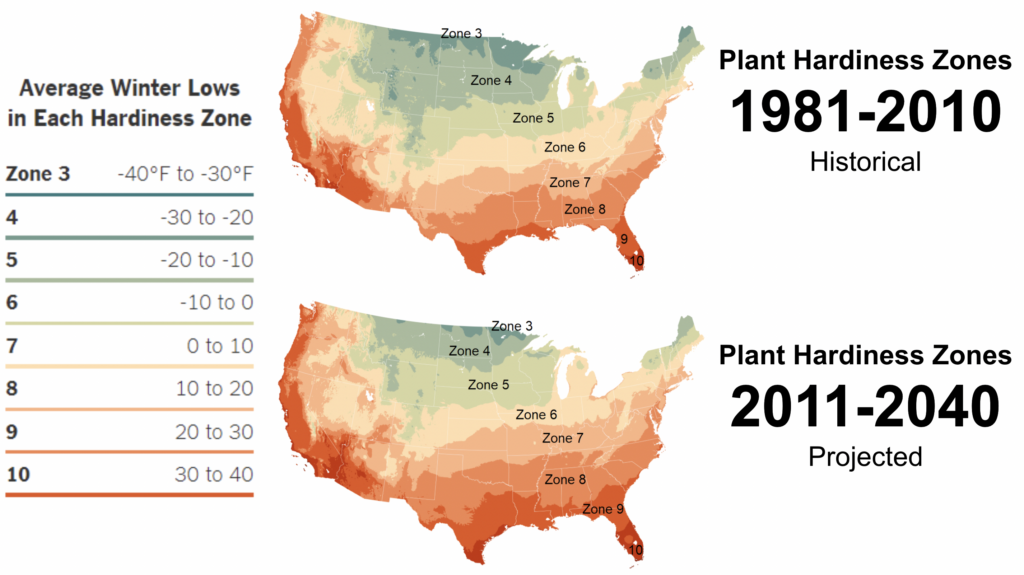
This slow reveal graph has been designed specifically to start to address the 4th grade 4.E1U1.8 Arizona Science Standard. Special thanks to STEMAZing Teacher Leader Mabel Rivera who co-designed this slow reveal graph. Google Slide Deck for Teachers
Read MoreSlow Reveal Graphs – Official Website
Slow Reveal Graph (#SlowRevealGraph) is an instructional routine that promotes sensemaking about data. This highly engaging routine uses scaffolded visuals and discourse to help students (in K-12 and beyond) make sense of data.
Read MoreSTEMAZing Slow Reveal Graphs
Slow Reveal Graphs designed by STEMAZing Teacher Leaders. #SlowRevealGraph is an instructional routine adaptable for all ages which promotes sensemaking about data.
Read MoreSeven String Kumihimo
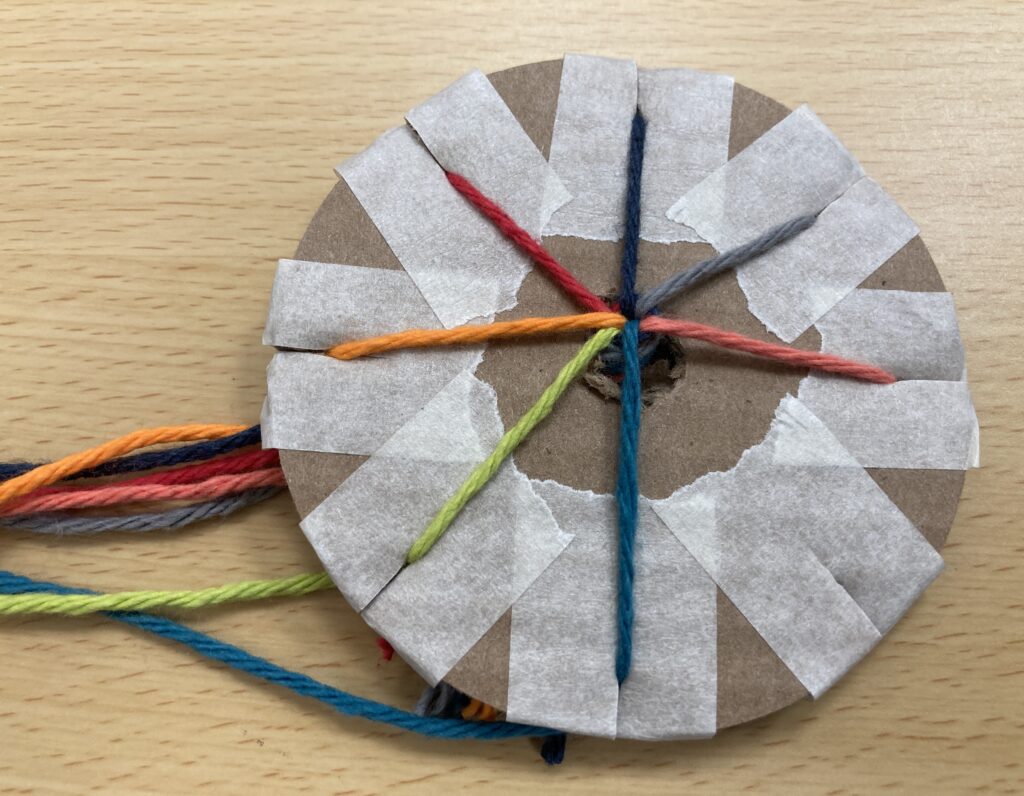
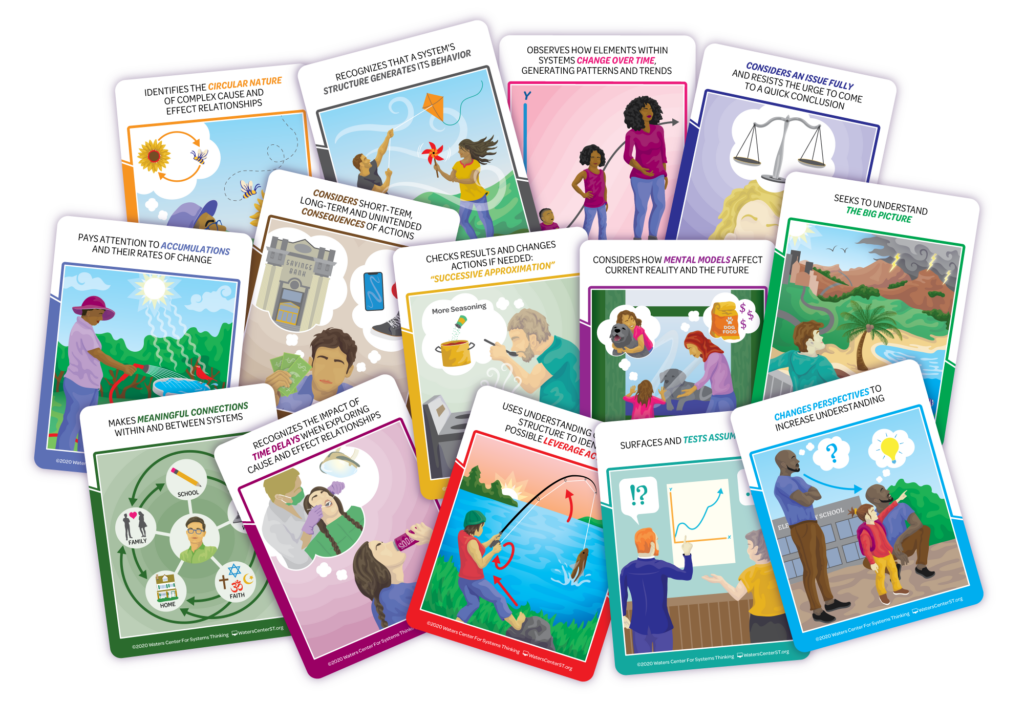
Seven String Kumihimo uses #STEMontheCheap materials to engage systems thinkers with a Japanese braiding technique called kumihimo, while at the same time challenging them to think about how a system’s structure generates its behavior.
Read MoreNotice and Wonder Habits Connect
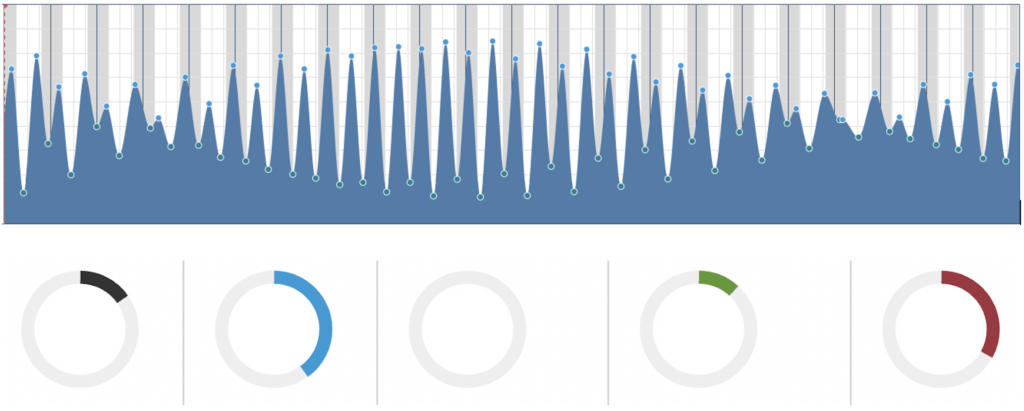
Slow Reveal Graph: Where does Arizona’s electricity come from?
This slow reveal graph has been designed specifically to start to address the 4th grade 4.P4U3.4 Arizona Science Standard. Special thanks to STEMAZing Teacher Leader Kathy Hartley who co-designed the student worksheets for this slow reveal graph. Google Slide Deck for Teachers (with question prompts on slides, includes teacher notes) Google Slide Deck for Teachers (without…
Read More